It is common to analyze stock markets data with multiple time series. The data can be plotted against well defined sampling variables based in the Gregorian calendar (Solar calendar) to understand the markets changes in a daily, weekly, monthly, yearly basis and any other combined or derived time metrics such as number of week, weekday, number of day in year, season (spring, summer, fall, winter), etc.
In the next plots you can move your mouse over the six different ranges of time periods [Semester, Trimester, Bimester, Monthly, Weekly, Daily]. It is possible to see that the second half of the year is better than the first, in corroboration of this data, the fourth trimester is the best in the stock markets. In addition, following this top-down approach reveals that the best bimester is November-December and the best month is November for the stock markets.
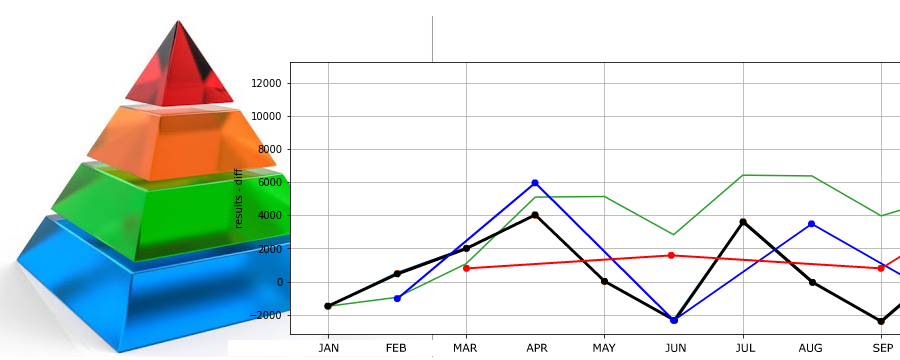
This top-down analysis similar to the pyramidal multi-layers of an image in image processing, where at the top level you can detect coarse pattern and when moving down the levels the image is getting clearer, revealing all the pixels details.
Moving to a more granular stage, the best week of the year is the 47th week, which falls in November. For the final level of sampling presented in this study the best days of the year in the stock market appear in different times of the year, at the beginning and at the end of the years. The day number 77 with nearly 1700 points, then day number 309 with nearly 1500 points and day number 340 with nearly 1500 points too.
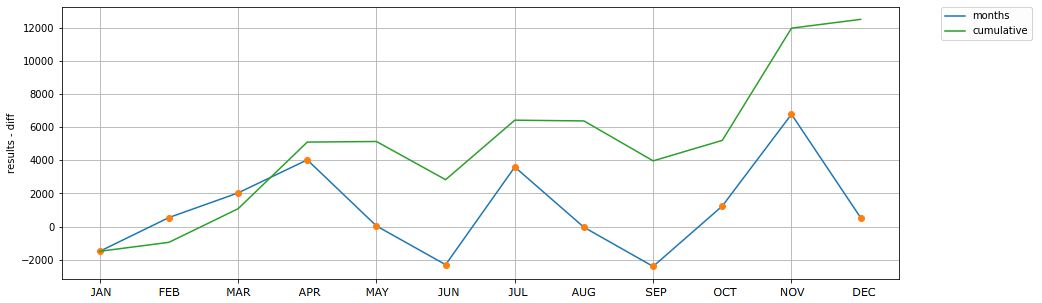
It is well know that historically the best months in the stock market are April and November, as these months have been registering the peaks in the markets and that June and September have been historically the worst months in the main stock markets (data from DOW index from 2000 to 2021).
If the sampling is set by day of the month, then it is possible to notice the best day for the stock market has been the 16th. While, for investing the 19th or 20th are the lowest points.
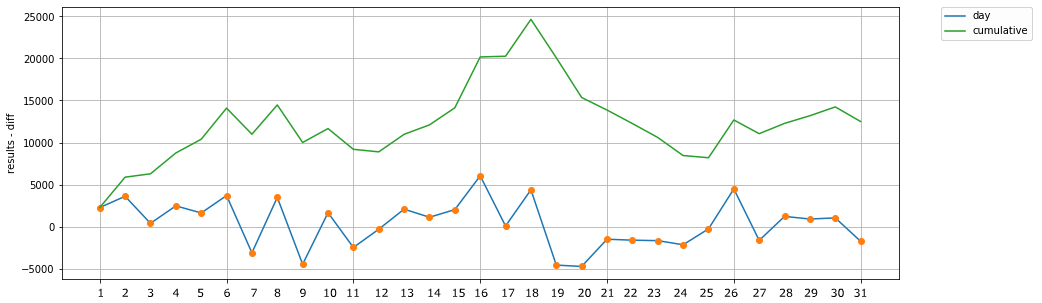
DOW stock market since 2000 to 2021 by day of the month.
Another interesting sampling is by the week day. The plot shows that Tuesdays have been the best day for the stock markets. While, Fridays the worst.
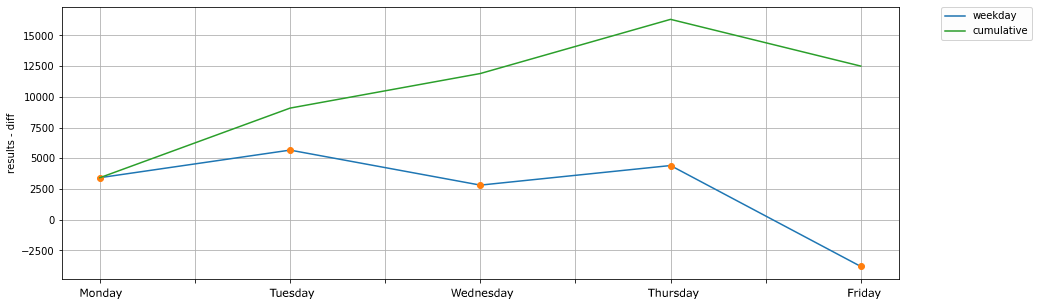
DOW stock market since 2000 to 2021 by week day.