The teams winning percentages in the analyzed NBA seasons (1990-1991 to 2013-2014) ranged from ≈25% to ≈70%. If grouping teams: Teams with low winning percentage can be defined as teams Wpct < 35%; Team with high winning percentage can be defined as teams Wpct > 60%; Teams with mediocre winning percentage are the teams in between the high and low groups.
For example, in the NBA season 2011-2012. It is possible to identify the six teams with low winning percentages Wpct≈28%, the four teams with high winning percentages Wpct≈73%. And the teams with mediocre winning percentage.
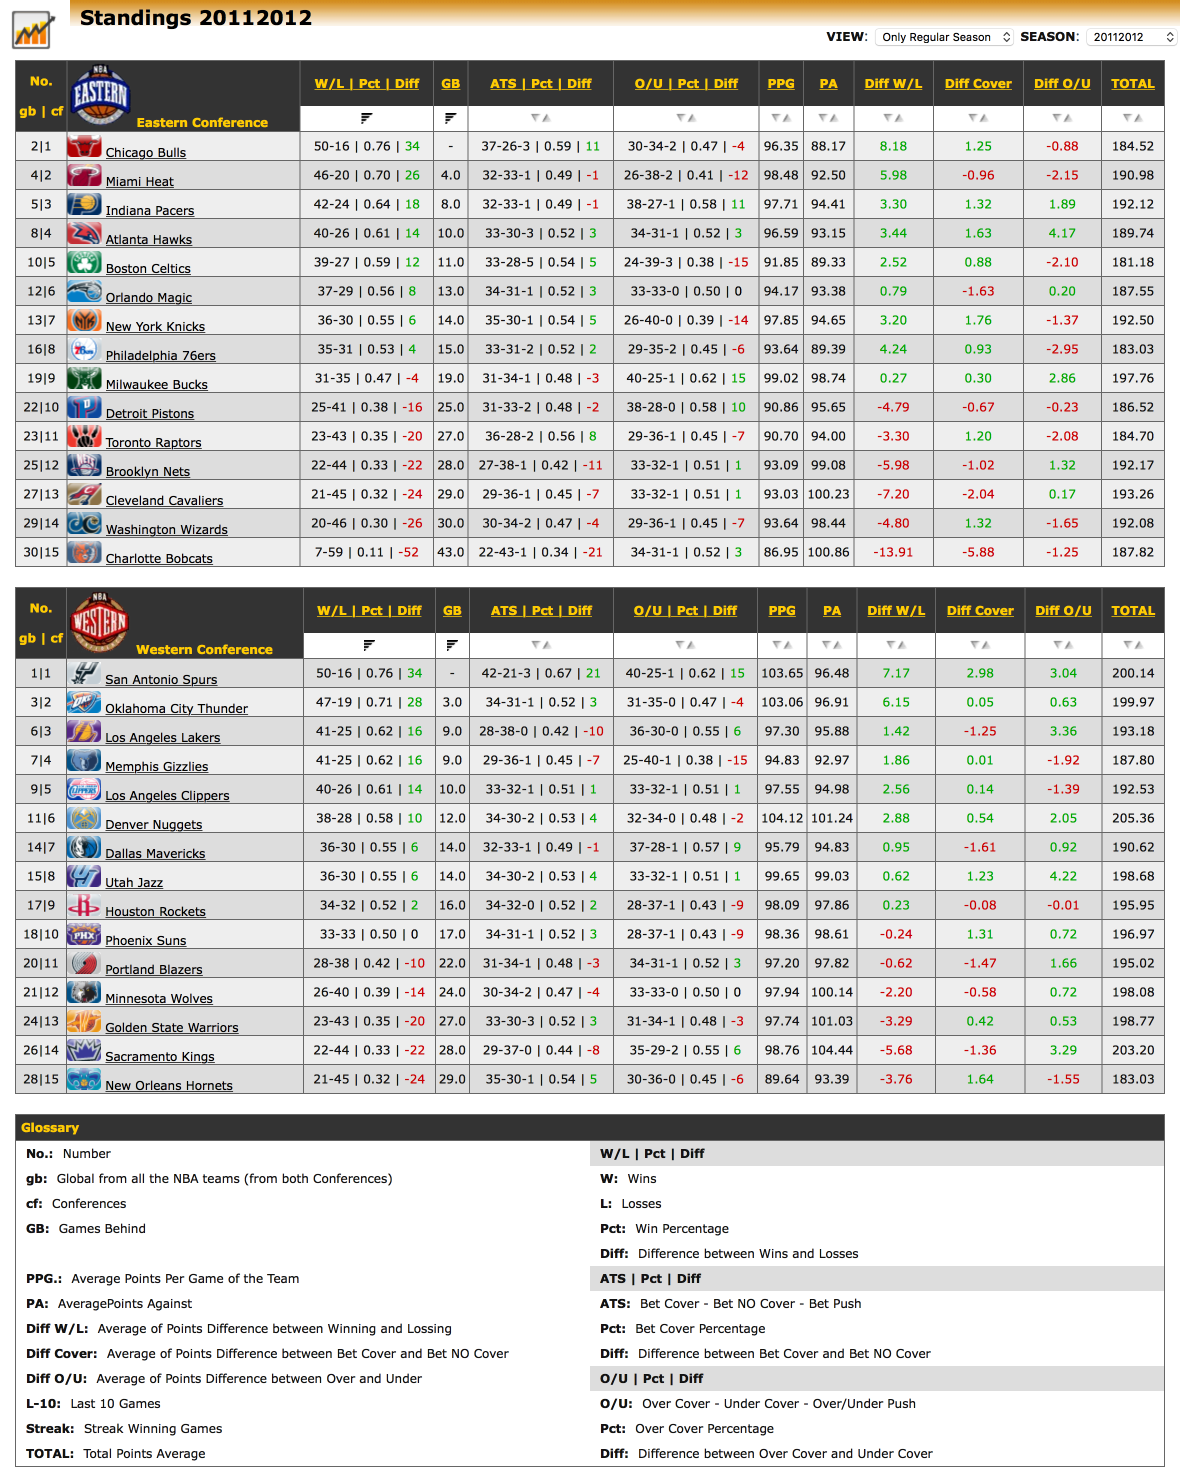
Teams sorted by winning percentages in NBA season 2011-2012
The key and novelty of the presented methodology is to analyze the data by taking into account the position of the teams from their winning percentages to find a factor analysis that correlates the team’s position to the betting variables.
The first analytic factor is to understand how much the teams winning percentages vary in the data set. From each NBA season the teams are sorted from their winning percentages and added together for each NBA seasons subgroup.
The regression analysis includes the NBA seasons from 1990-1991 to 2013-2014 subdivided in 3 subgroups, defined by the number of teams per season. The first subgroup includes the seasons 1990-1991 to 1994-1995 when the NBA has only 27 teams, the second subgroup includes the seasons 1995- 1996 to 2003-2004 when the NBA has 29 teams, and the last subgroup includes the seasons from 2004-2005 to the 2013- 2014 when the NBA started to have 30 teams. Note that this regression study only comprises the games in regular season from 1990-1991 to 2013-2014.
A. How much does the variable win varies?
The plot from the win variable sorted by wining percentages, reveals that the teams with high winning percentages have in average THwpct≈70% while the teams with low winning percentages have around TLwpct≈25%. Also, the plot shows a similarity in the shape and extremes in the three subgroups. The team with highest winning percentages is nearly tHwpct≈80% and the team with lowest winning percentages is below tLwpct≈20%. In this sense, the win variable is easier to differenciate if taking into account not only the teams with the best tHwpct and the worst tLwpct winning percentage. But also, if taking a couple of groups (i.e., the six most winning teams and their counterpart, the six teams with lower winning percentage).
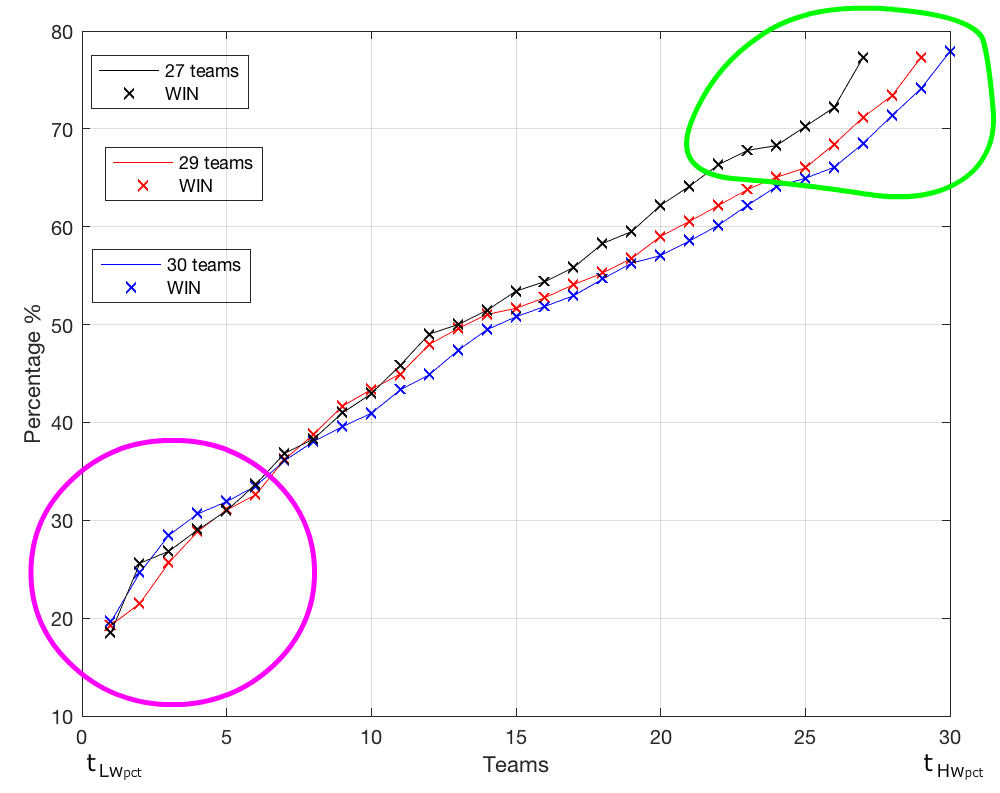
Teams winning percentages 1990- 1991 to 1994-1995 season (27 teams); 1995-1996 to 2003-2004 season (29 teams); 2004-2005 to 2013-2014 season (30 teams)
B. How much does the variable cover the point spread varies?
The variable cover sorted by the teams winning percentage, so the team in the position 1 is the team tLwpct with the lowest winning percentage and the team in position 27, 29 and 30 are the team tHwpct with the highest winning percentage in each subgroup of NBA seasons.
It is possible to notice that the pattern of the plot follows the shape of the winning percentages plot. Eventhough the plot shows high frequency changes, the teams with high covering percentage THcpct≈THwpct approximate the teams with high winning percentages and the teams with low covering percentage TLwpct≈TLwpct approximate the teams with low winning percentages.
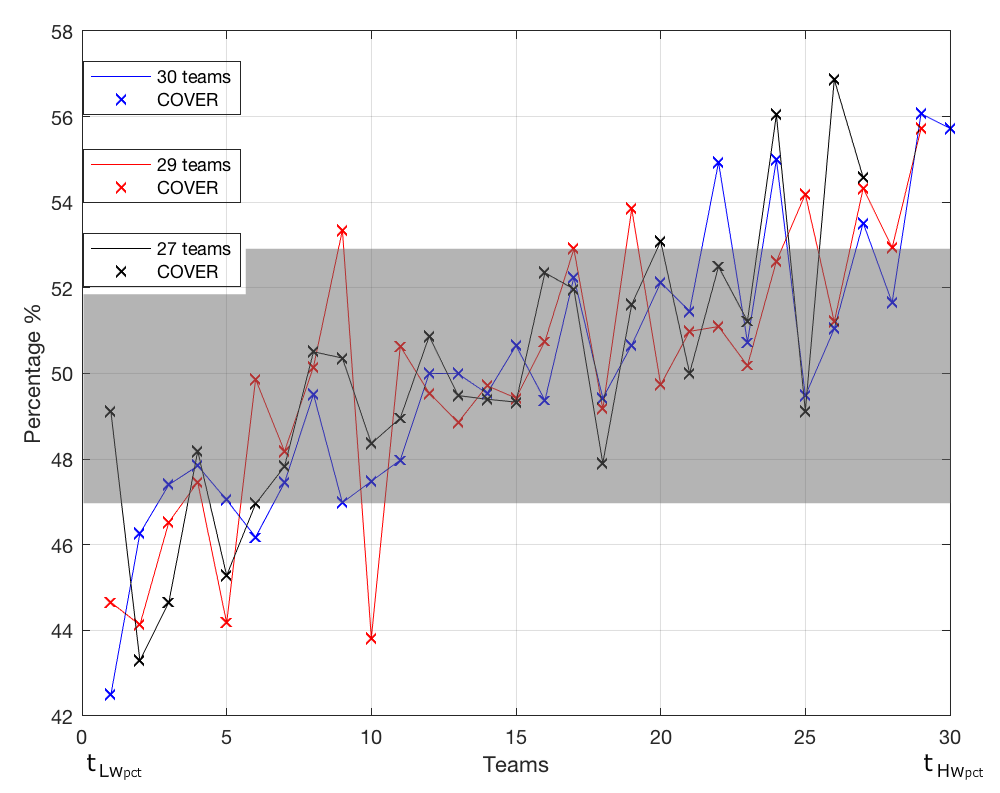
Betting variable cover the point spread, sorted by teams winning averages (1990-1991 to 1994-1995 season (27 teams); 1995-1996 to 2003-2004 season (29 teams); 2004-2005 to 2013-2014 season (30 teams). (Gray area is defined as the house edge of ±2:54%)
C. How much does the variable over the total points line (TPL) varies?
The variable over shows an inverted behaviour from the cover and win variables. Similar to the previous plot, the team in the position 1 is the one with the lowest winning percentage.
Even if the plot reveals a pattern, most of the points fall within the range of the house edge of 50%±2.54% (highlighted in gray area in Figures).
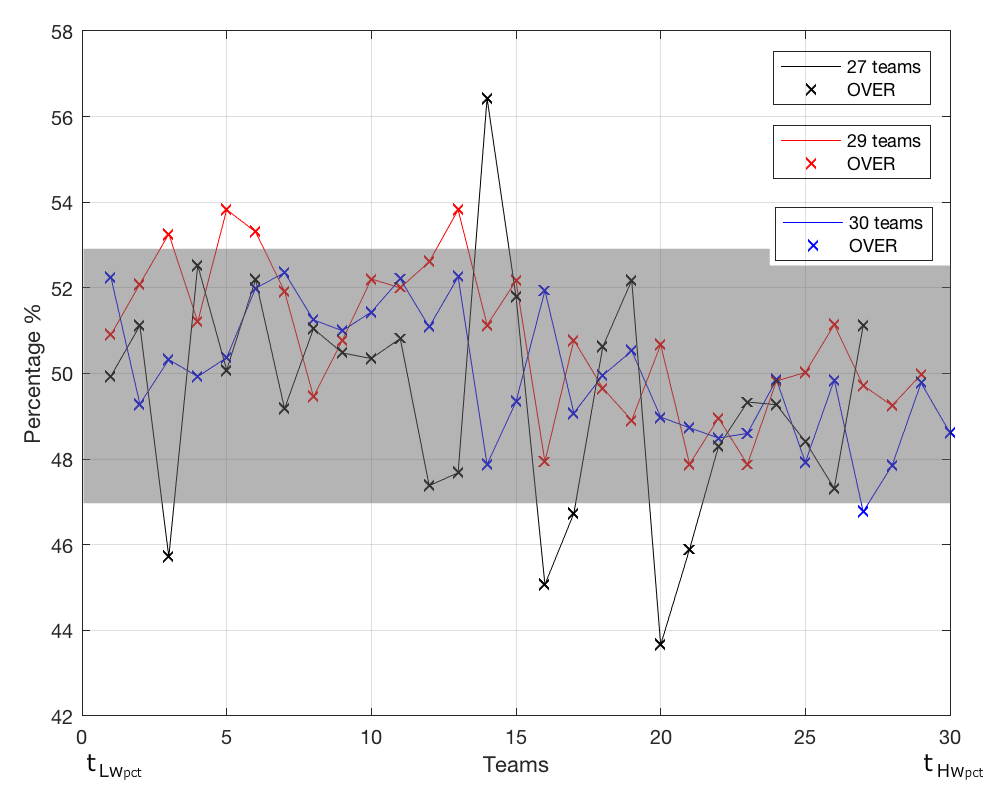
Betting variable over the total points line (TPL), sorted by teams winning averages (1990-1991 to 1994-1995 season (27 teams); 1995-1996 to 2003-2004 season (29 teams); 2004-2005 to 2013-2014 season (30 teams). (Gray area is defined as the house edge of ±2.54%)
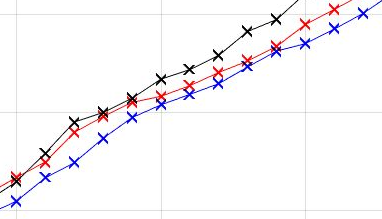
D. How much does the variable cover the point spread varies with respect to win?
The results reveal a factor analysis between the win and the cover variables. The cover variable tends to follows on the positive outliers from the THwpct teams with the best winning percentages and tends to follow on the negative outlier from the TLwpct teams with the worst winning percentages. While, the teams with mediocre winning percentages remain inside the house edge threshold of±2.4%.
However, the tendency win<->cover is not straightforward. In the results for the seasons 1990-1991 to 1994-1995 (27 teams) positive outliers exist for the two most winning teams. But, for the tLwpct team with the lowest winning percentage there is no outlier as its cover variable falls inside the house edge, around ≈49%.